Evaluation of Strain (Circumferential and Radial) from Short Axis View
Features
Torsion (°/cm)
AS (I35.0)HFrEF (I50.1)
Circumferential Strain (Test) (%)
AS (I35.0)HFrEF (I50.1)
Torsion
Some random stuff:
There are three features that represent different aspects of torsion: Endocardial Torsion, Epicardial Torsion, and Global Torsion.
def evaluate_torsion(seg_sa: Tuple[float, float, float, float], nim_sa: nib.nifti1.Nifti1Image, contour_name_stem):
    pass
Individuals with chronic aortic stenosis have been shown to display elevated peak LV torsion compared with healthy controls (Esch & Warburton, 2009).
Reductions in peak and peak rates of torsion and recoil have been shown to be reduced in heart failure patients with a reduced ejection fraction. However, conversely, heart failure with preserved ejection fraction have normal LV twist and untwist.(Esch & Warburton, 2009)
Esch, B. T., & Warburton, D. E. R. (2009). Left ventricular torsion and recoil: Implications for exercise performance and cardiovascular disease. Journal of Applied Physiology, 106(2), 362–369. https://doi.org/10.1152/japplphysiol.00144.2008
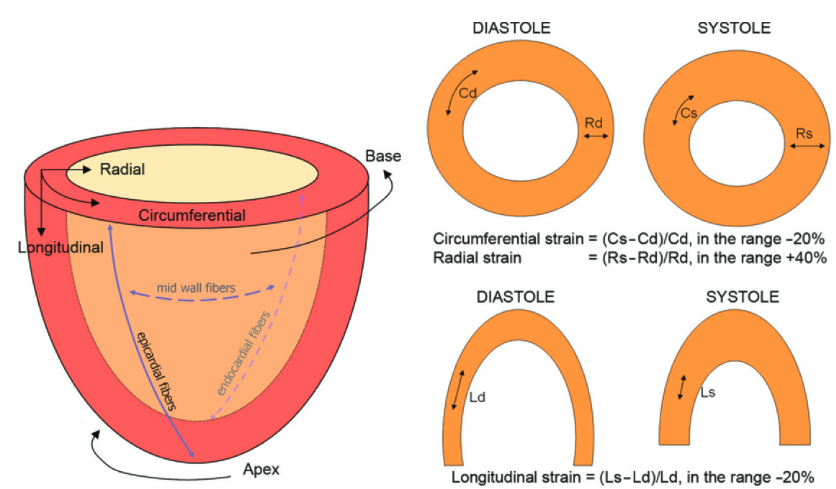
Strain heterogeneities revealed by tagging have been described in several review articles (6,7,15,16). 1. As one moves from the base to the apex, the circumferential and longitudinal strains increase, whereas the downward base motion is greater than apical rising (the apex pulls the ventricular base down with a tethering movement).This apparent discrepancy highlights the fact that the passive tethering motion (higher at the base) does not reflect the true active contraction phenomenon expressed by strain (higher at the apex). 2. As one moves from the epicardium to the endocardium, the circumferential, longitudinal, and radial strains (as well as torsion) increase. 3. The circumferential and longitudinal strains are greater in the lateral wall and lesser in the septum. 4. Contraction begins in the lateral wall, whereas the septum is the last part to be activated. Conversely, the peak of contraction is initially reached by the septum (shorter contraction time), and then by the lateral wall.
MR tagging–derived strains provide useful objective quantitative indexes that are superior to the simple visual assessment of LV motion abnormalities and improve the diagnostic performance of a dobutamine stress test for the detection of coronary heart disease in patients with complaints of chest pain (23).
Jeung, M.-Y., Germain, P., Croisille, P., Ghannudi, S. E., Roy, C., & Gangi, A. (2012). Myocardial Tagging with MR Imaging: Overview of Normal and Pathologic Findings. RadioGraphics, 32(5), 1381–1398. https://doi.org/10.1148/rg.325115098
LV GLS is more sensitive than ejection fraction (EF) to diagnose mild systolic dysfunction, as shown in different patient populations, including heart failure with preserved EF, coronary artery disease, diabetes, hypertensive heart disease, and cardiomyopathies with LV hypertrophy.124-129 Figure 20 illustrates 3 different mechanisms that may explain why GLS is superior to EF as measure of mild systolic dysfunction. First, longitudinally oriented myofibers, which determine GLS, dominate in the LV subendocardium, whereas myofibers with circumferential orientation are dominant in the midlayer of the wall. The inner layer of the LV wall tends to develop ischemia earlier than the outer layers, and therefore the subendocardium is the most vulnerable part of the wall. Because myocardial fibers in different LV wall layers are tethered together, reduced shortening in the subendocardium leads to reduced shortening in all layers in the wall. This is suggested as an explanation for why reduction of GLS is an early sign of LV dysfunction (Figure 20A). The tendency to develop subendocardial infarctions in acute coronary syndrome is well known and reflects the vulnerability of the inner wall layers. The subendocardium is susceptible to ischemia also in the absence of epicardial coronary artery stenosis. This is attributed to higher compressive forces on the intramyocardial vessels in the subendocardium than in the outer layers130 and longer distance from the epicardial coronary arteries. These effects are enhanced in hypertrophic ventricles. Furthermore, subendocardial perfusion may be impaired because of
microvascular remodeling and fibrosis, which tend to occur first in the subendocardium.126 Therefore, several factors may contribute to subendocardial dysfunction and cause reduction in LV longitudinal shortening. Second, because of the elliptical geometry of the ventricle, longitudinal contractions have less impact on LV volume and LVEF than circumferential contractions. This is illustrated in Figure 20B by a much flatter slope for the relationship between GLS and EF than for global circumferential strain and EF. As shown in a simulation study, the contributions from circumferential and longitudinal shortening to stroke volume were 67% and 33%, respectively.131 With the ventricle as an approximate ellipsoid, circumferential contraction implies shortening of the entire LV shortaxis area (ie, 2 spatial dimensions, x and y), whereas longitudinal shortening causes reduction in only 1 dimension (z). Using a cube as analogy makes this distinction more obvious. As an example, when contracting by 20% in both the x and y dimensions, volume is reduced to 64% (0.8 0.8) of the initial volume. When contracting only in the z-axis (equivalent to GLS), a 20% shortening results in a volume that is 80% of the initial volume. For patients with EFs in the lower normal range, one would predict that a moderate reduction in GLS will cause a small reduction in EF to a subnormal value. However, for ventricles with EFs in the midnormal or upper normal range, EF may remain within the relatively wide normal range, although GLS is mildly reduced. When considering the 2 mechanisms illustrated in Figures 20A and 20B together, they may explain why mild LV systolic dysfunction is reflected in reduced GLS, whereas EF may remain in the normal range. Third, LV hypertrophy is an additional mechanism that tends to preserve EF (pseudonormal function) when there is impaired systolic function.131,132 This is in part because hypertrophic and thick LV walls tend to cause small LV diastolic cavity volumes. Therefore, in hypertrophic LVs with reduced cavity size, a small contraction and a small stroke volume may represent a large relative change in cavity volume, and therefore EF may be normal in a dysfunctional ventricle. In addition, the same percentage thickening results in more absolute thickening when the wall is thicker prior to contraction (Figure 20C). Therefore, hypertrophic ventricles with thick walls may have normal EFs despite reduced systolic function. In some cases, a hypertrophic ventricle with reduced contractility may show almost complete closure of the cavity in end-systole, which is measured as a supernormal EF. In these cases, the systolic dysfunction is confirmed by reduction in GLS. Typical examples are hypertrophic cardiomyopathy and amyloidosis. A similar mechanism may explain normal EF but reduced longaxis shortening in patients with hypertensive LV hypertrophy
Smiseth, O. A., Rider, O., Cvijic, M., Valkovič, L., Remme, E. W., & Voigt, J.-U. (2024). Myocardial Strain Imaging. JACC: Cardiovascular Imaging, S1936878X24003012. https://doi.org/10.1016/j.jcmg.2024.07.011
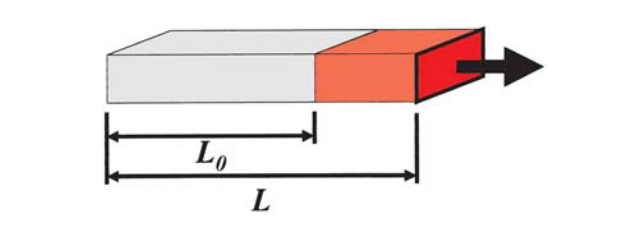
In solid-state physics, one-dimensional strain is defined as the change in length relative to baseline length of an object due to a stress (Fig. 1 a). It can be measured in all three spatial dimensions (normal strains). Relative displacements of one object border with respect to the object’s parallel border are called shear strains
Linear “Lagrangian” strain eLagrange is defined as the ratio of the difference between length after deformation L and baseline length L0 divided by baseline length [7]: eLagrange L L0 L0 It is a dimensionless number and usually given as a percentage: a strain of 15% implies a lengthening of 15% in relation to baseline length. The velocity of deformation over time (the temporal derivative of strain) at time t is called the strain rate (SR): SR t de t dt
In accordance with findings from animal experiments, both types of ischemia lead to characteristic changes in deformation patterns (Figs. 4, 5): n overall decrease of systolic and diastolic strain rates; normally negative systolic strain rates may even become positive (longitudinal expansion instead of shortening, reflecting systolic bulging); n delay in systolic strain (“tardokinesia”); n new occurrence of or increase in post-systolic shortening during the isovolumic relaxation period, which accounts for an increasing fraction of total shortening.
hypokinesia (reduced shortening), akinesia (absent shortening), or dyskinesia (lengthening)
Voigt, J.-U., & Flachskampf, F. A. (2004). Strain and strain rate. Zeitschrift F�r Kardiologie, 93(4), 249–258. https://doi.org/10.1007/s00392-004-0047-7