Evaluation of Ventricular Volume
Description of Modality
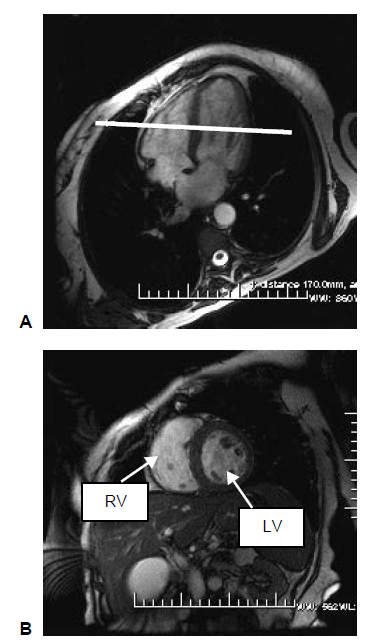
A complete short axis (SA) stack of balanced steady state free precession (bSSFP) cines covering the left ventricle (LV) and right ventricle (RV). A short-axis image stack typically consists of 10 image slices. Each cardiac cycle consists of 50 time frames (Petersen et al., 2015).
To acquire a short axis view, center perpendicular to the septum on the four-chamber long axis view (HLA). The resultant image will demonstrate the LV and RV in a nice circular shape.
 (M.D et al., 2008)
The high resolution offered by CMR, have permitted unparalleled ability to accurately delineate myocardium and blood pools. The CMR now becomes the "gold standard" for LV/RV functional assessment because (M.D et al., 2008):
- High resolution
- High endocardial and epicardial intrinsic contrast
- Absence of foreshortening, due to exact placement of anatomy by prescription
- Near absence of any user-dependence limitation
- Reproducibility and accuracy to within 5 mL of volume
- Not dependent on any geometric assumptions
- Ability to perform three-dimensional (3D) imaging for exact measurements quickly (no absolute need for 2D anymore)
- Volume-time measurements
- Regional LV quantification; visually and/or quantitatively
- Moderate to high temporal resolution
Definition of Features
| Feature Name | Target | Description | Unit |
|---|---|---|---|
| T_ED | LV | End-diastolic time | frame, ms |
| T_ES | LV | End-systolic time | frame, ms |
| V_ED | LV & RV | End-diastolic volume | mL |
| V_ES | LV & RV | End-systolic volume | mL |
| SV | LV & RV | Stroke volume | mL |
| CO | LV & RV | Cardiac output | L/min |
| EF | LV & RV | Ejection fraction | % |
| Mass_ED | Myo | Myocardium mass at end-diastole | g |
| Mass_ES | Myo | Myocardium mass at end-systole | g |
| CI | LV & RV | Cardiac index | |
| D_transverse_ED (sax) | LV | Transverse diameter obtained using short axis at end-diastole | cm |
| D_longitudinal_ED (4ch) | LV | Longitudinal diameter obtained using four chamber long axis at end-diastole | cm |
| D_transverse_ED (4ch) | LV | Transverse diameter obtained using four chamber long axis at end-diastole | cm |
| D_transverse_ES (sax) | LV | Transverse diameter obtained using short axis at end-systole | cm |
| D_longitudinal_ES (4ch) | LV | Longitudinal diameter obtained using four chamber long axis at end-systole | cm |
| D_transverse_ES (4ch) | LV | Transverse diameter obtained using four chamber long axis at end-systole | cm |
| Sphericity_Index_ED | LV | Sphericity index at end-diastole | - |
| Sphericity_Index_ES | LV | Sphericity index at end-systole | - |
| PFR-E | LV | Early peak filling rate | mL/s |
| PFR-A | LV | Atrial peak filling rate | mL/s |
| PFR-E/PFR-A | LV | Ratio between early peak filling rate and atrial peak filling rate | - |
Features: Definition, How to Derive, and Clinical Relevance
Volume
The volumes are calculated by summing up the number of voxels belonging to the corresponding label class in the segmentation, multiplied by the volume per voxel as in (Bai et al., 2018).
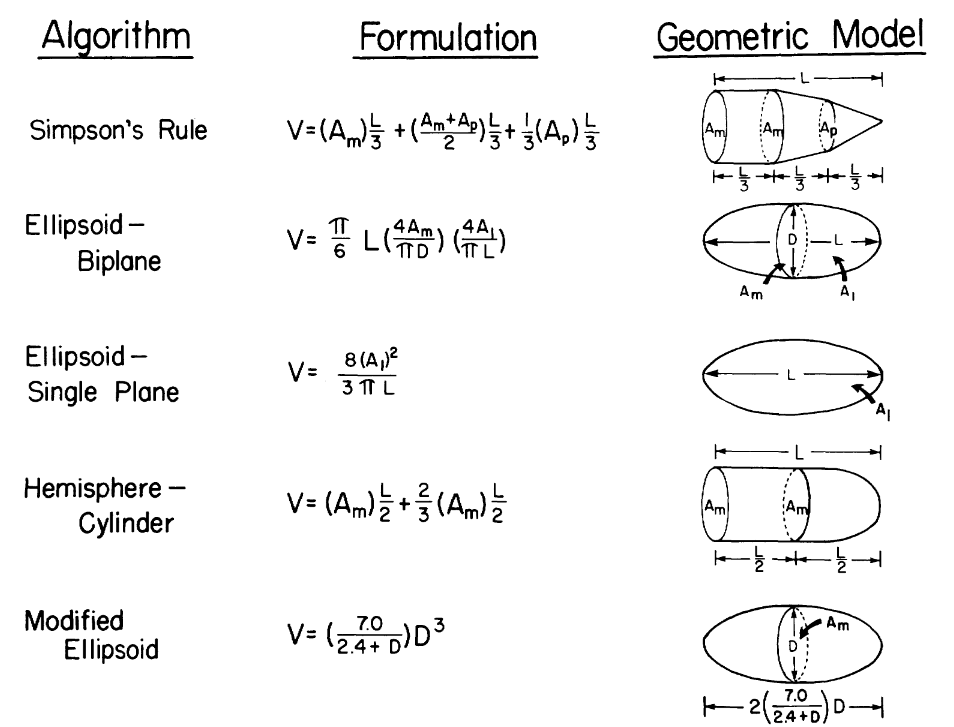
Meanwhile, there are alternative algorithms to calculate the volume that require fewer slices to be obtained, each assuming different geometric model for the ventricle. For instance, the modified Simpson's rule, which consider the ventricle as the sum of a cylinder (from the base to the mitral valve), a truncated cone and another cone attributed to the cardiac apex, each assuming to be of equal height, is superior to algorithms that only make use of one plane. (Folland et al., 1979). The Simpson's rule is also reported to yield good correlation when comparing functional parameters in all imaging planes, and perform better than the Ellpsoid-Biplane method (also known as Area-Aength method) (Hergan et al., 2008).
 (Folland et al., 1979)
Stroke Volume
The stroke volume (SV) is defined as the chamber volume ejected in systole, and can be simply calculated as the difference between the end-diastolic volume and the end-systolic volume .
Cardiac Output and Cardiac Index
The cardiac output is the amount of blood the heart pumps in one minute, usually expressed in liters/minute and can be calculated as the product of the stroke volume and the heart rate.
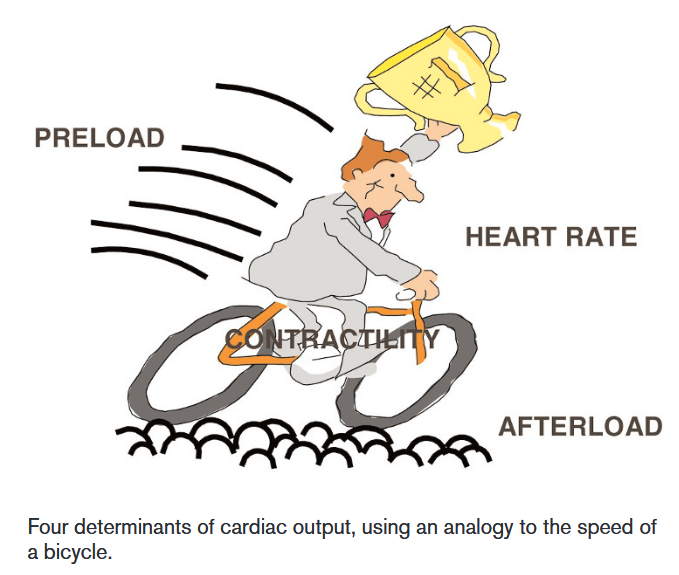
There are four determinants of cardiac output: Heart rate, contractility, preload and afterload, which can be understood through the analogy of a bicycle:
 (Vincent, 2008)
- The faster the heart beats, the more blood can be pumped out over a particular period of time.
- The harder the cyclist pushes on the pedals, the faster the bicycle will be, which can be equated to an increased contractility of the heart muscle.
- The preload, defined as the volume in the ventricles at the end of diastole, can be equated as the tailwind that allows the cyclist to move faster without any additional muscular effort, since the greater the stretch of myocardial cells, the greater the force of contraction will be.
- The afterload, defined as the resistance the heart must overcome to eject blood during systole, can be equated as the resistance of the road when cycling. The greater the afterload, the harder the heart must work to maintain the same cardiac output, leading to a decrease in cardiac output.
Vincent, J.-L. (2008). Understanding cardiac output. Critical Care, 12(4), 174. https://doi.org/10.1186/cc6975
Preload Preload is the degree of myocardial distension prior to shortening. As initially demonstrated by Otto Frank and Ernest Starling, an intrinsic property of myocardial cells is that the force of their contraction depends on the length to which they are stretched: the greater the stretch (within certain limits), the greater the force of contraction. An increase in the distension of the ventricle will therefore result in an increase in the force of contraction, which will increase cardiac output. In our analogy, preload can be compared with a tailwind allowing the cyclist to move faster without any additional muscular effort. Of course, unlike our analogy – in which the speed of the bicycle will continue to increase as the speed of the wind increases – in the heart a preload value will eventually be reached at which cardiac output will no longer increase Preload largely depends on the amount of ventricular filling. It should not, however, be confused with the venous return. In our analogy, the venous return is like the speed of the bicycle coming towards us. The amount of blood returning to the heart in any period of time must be equal to the amount of blood pumped by the heart in the same period, as there is no place for storage of blood in the heart. Venous return therefore equals cardiac output, whereas preload is only one component of cardiac output.
Afterload Afterload is the force against which the ventricles must act in order to eject blood, and is largely dependent on the arterial blood pressure and vascular tone. By cycling on a large smooth road rather than a narrow, bumpy one, or on a road with a gentle downhill slope, the bicycle’s speed can increase significantly for a given degree of muscular effort. A tired cyclist is particularly sensitive to these aspects. Similarly, reducing afterload can increase cardiac output, especially in conditions where contractility is impaired.
Ejection Fraction
The ejection fraction, especially the left ventricular ejection faction (LVEF), is simplest and the most well-accepted expression of global LV systolic function. EF is defined as the ratio between stroke volume and end-diastolic volume , essentially being a measurement of endocardial strain. EF is more useful marker than the stroke volume, since it accounts for the Frank-Starling relationship, which states that the stroke volume increases in response to an increase in end-diastolic volume (Kirkpatrick et al., 1976). Particularly, the excellent contrast resolution of cardiac magnetic resonance (CMR) has made itself the reference standard among non-invasive modalities.
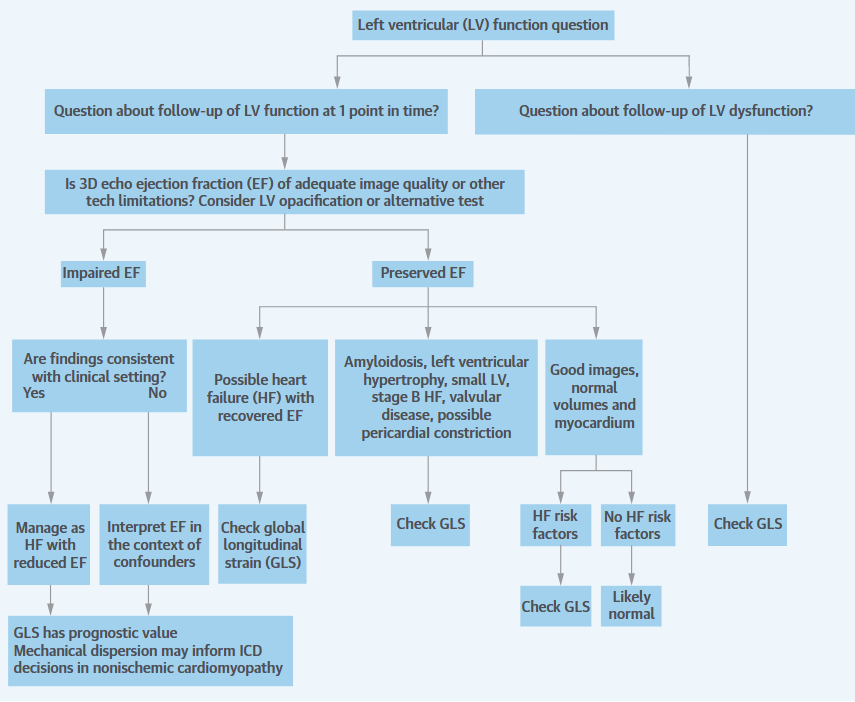
LVEF, serving as a marker of gross LV dysfunction has become the primary criterion used in clinical practices:
Patients with heart failure (HF) can be classified into several groups: those with reduced ejection fraction (HFrEF), those with preserved ejection fraction (HFpEF), an intermediate group called HF with mid-range EF (HFmrEF). The HFrEF is defined as LVEF < 40%, while the HFpEF is defined as LVEF >= 40% or 50%. However, it doesn't mean patients with HFpEF have normal systolic function (Marwick, 2018). An additional group hF-Recovered (HFrecEF) may be defined as patients who have documented history of EF < 50% (Basuray et al., 2014). EF has been shown to have prognostic, as higher LVEFs are associated with a linear decrease in mortality, particularly with EF < 40%. However, increases above 45% are not associated with further reductions in mortality (Solomon et al., 2005).
It now occupies a central position in guidelines for the use of implantable cardioverter-defibrillator device (ICD) when recommended for primary prevention of LV sudden cardiac death.
up to an LVEF of 45% among heart failure patients. However,
Additionally, it is an important parameter to monitor LV function in the course of cardiotoxic chemotherapy (chemotherapy drugs that can cause damage to the heart). If during chemotherapy, LVEF decreases > 10% from baseline to a final LVEF below 53%, patients must be referred to the cardio-oncology unit to consider heart failure therapy.
Moreover, in patients with valvular diseases, LVEF is also used as one of the criteria to determine management. Aortic valve replacement is recommended for asymptomatic patients with severe aortic stenosis (AS) or chronic severe aortic regurgitation (AR) and LVEF < 50%. Mitral valve surgery is considered for asymptomatic patients with LVEF <= 60% (Kosaraju et al., 2024).
An ejection fraction of <35% is important in decision-making regarding device therapy, either with implantable defibrillators or cardiac resynchronisation therapy. (ACC/AHA/NASPE 2002 Guideline Update for Implantation of Cardiac Pacemakers and Antiarrhythmia Devices, n.d.)
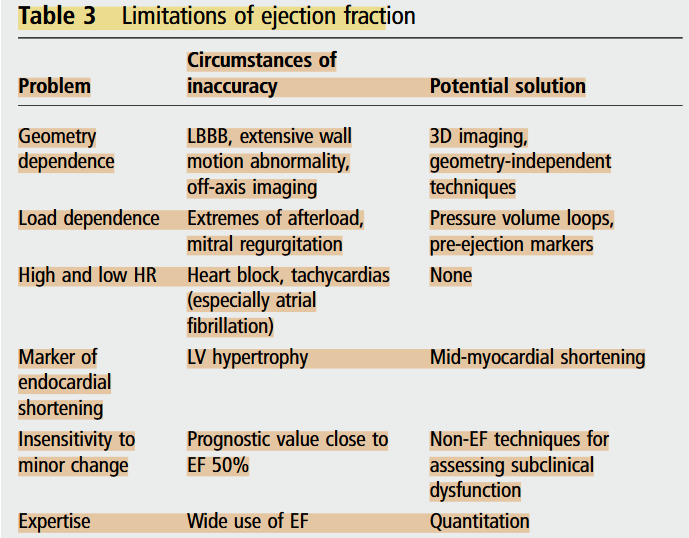
However, LVEF still has a number of important limitations and may provide suboptimal evaluation. Firstly, the ejection fraction is load-dependent, meaning that it cannot be interpreted as a reflection of contractility in the absence of knowledge about afterload and preload. Instead, the performance of a pressure-volume loop may better facilitate the understanding of contractility (Marwick, 2013). In addition, the ejection fraction is influenced by heart rate. The increased stroke volume associated with bradycardia may lead to overestimation of the true ejection fraction, and conversely in tachycardia, the reduced stroke volume may lead to underestimation of the actual function (Marwick, 2013).
Dimensions
Both longitudinal and transverse diameters can be derived for the left ventricle.
evaluate_ventricular_length_sax()
evaluate_ventricular_length_lax()
The LV mass is calculated by multiplying the LV myocardial volume with the density of 1.05g/mL (Bai et al., 2018).
Sphericity Index
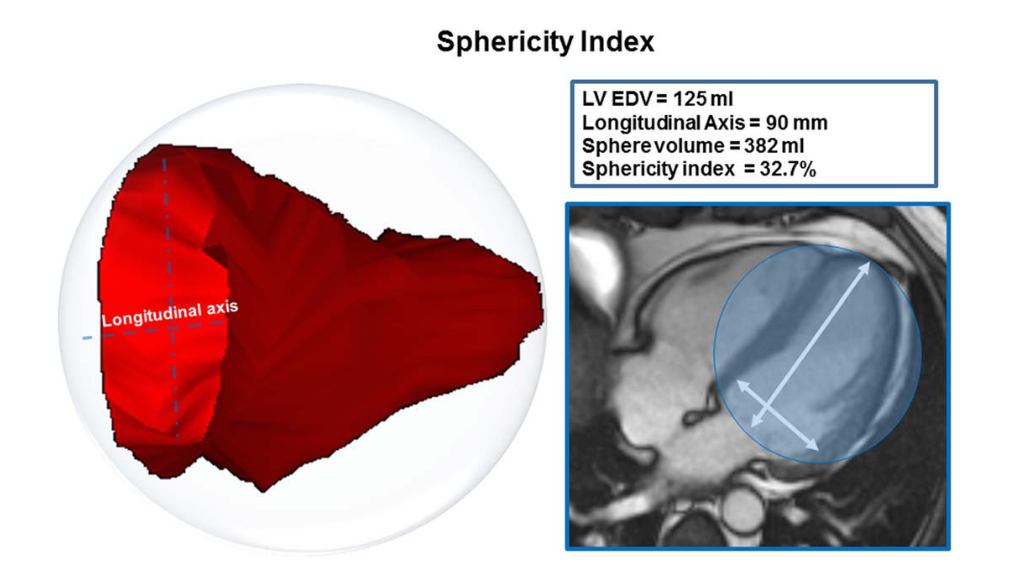
The sphericity index is calculated at end-systole and end-diastole as the volume of the left ventricle divided by the volume of a sphere whose diameter is equal to the longitudinal diameter (major axis of the ventricle). As this ratio increases, the shape of the left ventricle approaches that of a sphere (Kono et al., 1991).
 (Aquaro et al., 2017)
For patients with dilated cardiomyopathy (DCM), the more spherical LV chamber is shown by a few studies to be associated with higher end-systolic wall stress, an abnormal distribution of fiber shortening and a poor long-term survival. In patients with heart failure due to either coronary artery disease or dilated cardiomyopathy and LVEF <= 30%, a more spherical LV chamber is associated with the presence of functional MR (Kono et al., 1991).
References
Petersen, S. E., Matthews, P. M., Francis, J. M., Robson, M. D., Zemrak, F., Boubertakh, R., Young, A. A., Hudson, S., Weale, P., Garratt, S., Collins, R., Piechnik, S., & Neubauer, S. (2015). UK Biobank’s cardiovascular magnetic resonance protocol. Journal of Cardiovascular Magnetic Resonance, 18(1), 8. https://doi.org/10.1186/s12968-016-0227-4
Bai, W., Sinclair, M., Tarroni, G., Oktay, O., Rajchl, M., Vaillant, G., Lee, A. M., Aung, N., Lukaschuk, E., Sanghvi, M. M., Zemrak, F., Fung, K., Paiva, J. M., Carapella, V., Kim, Y. J., Suzuki, H., Kainz, B., Matthews, P. M., Petersen, S. E., … Rueckert, D. (2018). Automated cardiovascular magnetic resonance image analysis with fully convolutional networks. Journal of Cardiovascular Magnetic Resonance, 20(1), 65. https://doi.org/10.1186/s12968-018-0471-x
M.D, R. W. B., Biederman, R. W. W., Doyle, M., & Yamrozik, J. (2008). The Cardiovascular MRI Tutorial: Lectures and Learning. Lippincott Williams & Wilkins.
Kosaraju, A., Goyal, A., Grigorova, Y., & Makaryus, A. N. (2024). Left Ventricular Ejection Fraction. In StatPearls. StatPearls Publishing. http://www.ncbi.nlm.nih.gov/books/NBK459131/
Le, T.-T., Tan, R. S., De Deyn, M., Goh, E. P. C., Han, Y., Leong, B. R., Cook, S. A., & Chin, C. W.-L. (2016). Cardiovascular magnetic resonance reference ranges for the heart and aorta in Chinese at 3T. Journal of Cardiovascular Magnetic Resonance, 18, 21. https://doi.org/10.1186/s12968-016-0236-3
Kono T, Sabbah HN, Stein PD, Brymer JF, Khaja F. Left ventricular shape as a determinant of functional mitral regurgitation in patients with severe heart failure secondary to either coronary artery disease or idiopathic dilated cardiomyopathy. Am J Cardiol 1991;68:355–9.
ACC/AHA/NASPE 2002 Guideline Update for Implantation of Cardiac Pacemakers and Antiarrhythmia Devices: Summary Article. (n.d.). https://doi.org/10.1161/01.CIR.0000035996.46455.09
Marwick, T. H. (2013). Methods used for the assessment of LV systolic function: Common currency or tower of Babel? Heart, 99(15), 1078–1086. https://doi.org/10.1136/heartjnl-2012-303433
Folland, E. D., Parisi, A. F., Moynihan, P. F., Jones, D. R., Feldman, C. L., & Tow, D. E. (1979). Assessment of left ventricular ejection fraction and volumes by real-time, two-dimensional echocardiography. A comparison of cineangiographic and radionuclide techniques. Circulation, 60(4), 760–766. https://doi.org/10.1161/01.CIR.60.4.760
Kirkpatrick, S., Pitlick, P., Naliboff, J., & Friedman, W. (1976). Frank-Starling relationship as an important determinant of fetal cardiac output. American Journal of Physiology-Legacy Content, 231(2), 495–500. https://doi.org/10.1152/ajplegacy.1976.231.2.495
Hergan, K., Schuster, A., Frühwald, J., Mair, M., Burger, R., & Töpker, M. (2008). Comparison of left and right ventricular volume measurement using the Simpson’s method and the area length method. European Journal of Radiology, 65(2), 270–278. https://doi.org/10.1016/j.ejrad.2007.03.031
Marwick, T. H. (2018). Ejection Fraction Pros and Cons. Journal of the American College of Cardiology, 72(19), 2360–2379. https://doi.org/10.1016/j.jacc.2018.08.2162
Basuray, A., French, B., Ky, B., Vorovich, E., Olt, C., Sweitzer, N. K., Cappola, T. P., & Fang, J. C. (2014). Heart Failure With Recovered Ejection Fraction: Clinical Description, Biomarkers, and Outcomes. Circulation, 129(23), 2380–2387. https://doi.org/10.1161/CIRCULATIONAHA.113.006855
Solomon, S. D., Anavekar, N., Skali, H., McMurray, J. J. V., Swedberg, K., Yusuf, S., Granger, C. B., Michelson, E. L., Wang, D., Pocock, S., & Pfeffer, M. A. (2005). Influence of Ejection Fraction on Cardiovascular Outcomes in a Broad Spectrum of Heart Failure Patients. Circulation, 112(24), 3738–3744. https://doi.org/10.1161/CIRCULATIONAHA.105.561423
Vincent, J.-L. (2008). Understanding cardiac output. Critical Care, 12(4), 174. https://doi.org/10.1186/cc6975
EF has a number of important limitations
Marwick, T. H. (2013). Methods used for the assessment of LV systolic function: Common currency or tower of Babel? Heart, 99(15), 1078–1086. https://doi.org/10.1136/heartjnl-2012-303433
EF AND VOLUMES. In general, left ventricular ejection fraction (LVEF) is more useful than stroke volume as a marker of LV function, because it takes into account the Frank-Starling relationship.
LVEF is mainly affected by preload, afterload, and contractility,
WHAT EF HIDES. A major limitation of EF is that it is sometimes a source of disproportionate focus, to the exclusion of other features.
Marwick, T. H. (2018). Ejection Fraction Pros and Cons. Journal of the American College of Cardiology, 72(19), 2360–2379. https://doi.org/10.1016/j.jacc.2018.08.2162